May 10, 2024
What’s a data-driven marketing agency, and how to be one
10-MINUTE READ | By Anna Shutko & Rosanna Campbell
[ Updated May 20, 2024 ]
Many marketing agencies call themselves data-driven. But there’s a big difference between being data-aware and truly data-driven.
So, how can you become a genuinely data-driven marketing agency? In this article, we’ll break down the characteristics of data-driven marketing agencies, why it’s worth becoming one, and how to overcome the common struggles that we see our marketing agency customers wrestling with.
Coming up:
- Is your agency truly data-driven?
- 7 steps to become a data-driven marketing agency
- Challenges to becoming a data-driven marketing agency and how to solve them
- How to get your clients excited about data
- Additional resources
Is your agency truly data-driven?
A data-driven marketing agency bases its strategies and decisions primarily on collected and analyzed data instead of relying solely on experience and industry knowledge like a traditional marketing agency.
Here’s how to know if you’re a truly data-driven marketing agency. Do you have:
A clean, robust data pipeline
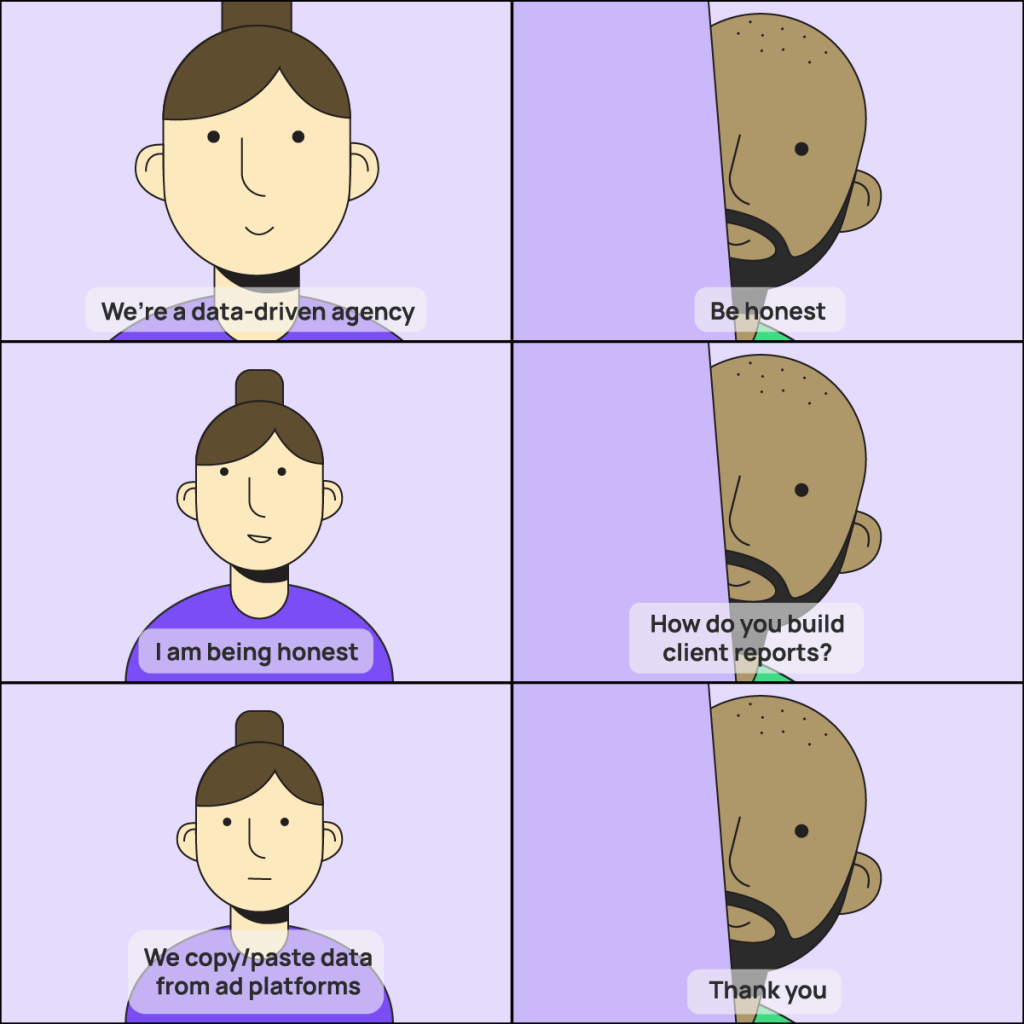
To state the obvious for a second: data-driven agencies make decisions using data, which means they have accurate data available.
That doesn’t necessarily mean you need a marketing data warehouse. A small marketing agency may not yet have the resources (or need) for a warehouse. You could be working with data in a spreadsheet or a Looker Studio report. You could partner with a third-party provider.
The key is that you know where your data is coming from and that it’s accurate, well-prepared, and collected automatically (no copy-pasting CSV files into a spreadsheet, please!)
You can also bring data together from different sources and marketing channels to create a comprehensive picture of the client’s current marketing metrics and measure the results of your new strategies and tactics.
Meaningful reports
Simply being able to access marketing data isn’t enough to be data-driven. Genuinely data-driven marketing agencies have a clear set of reports that answer well-defined, specific questions.
These aren’t general reports or “all we can get” reports that dump information on clients without providing any actionable insights. Rather, each report will have a clear structure that addresses a single business need. Data-driven agencies won’t just tell you what the data shows—they’ll have the knowledge and experience to analyze it and use their insights to suggest new approaches.
📖 Read more in our comprehensive guide to marketing reporting.
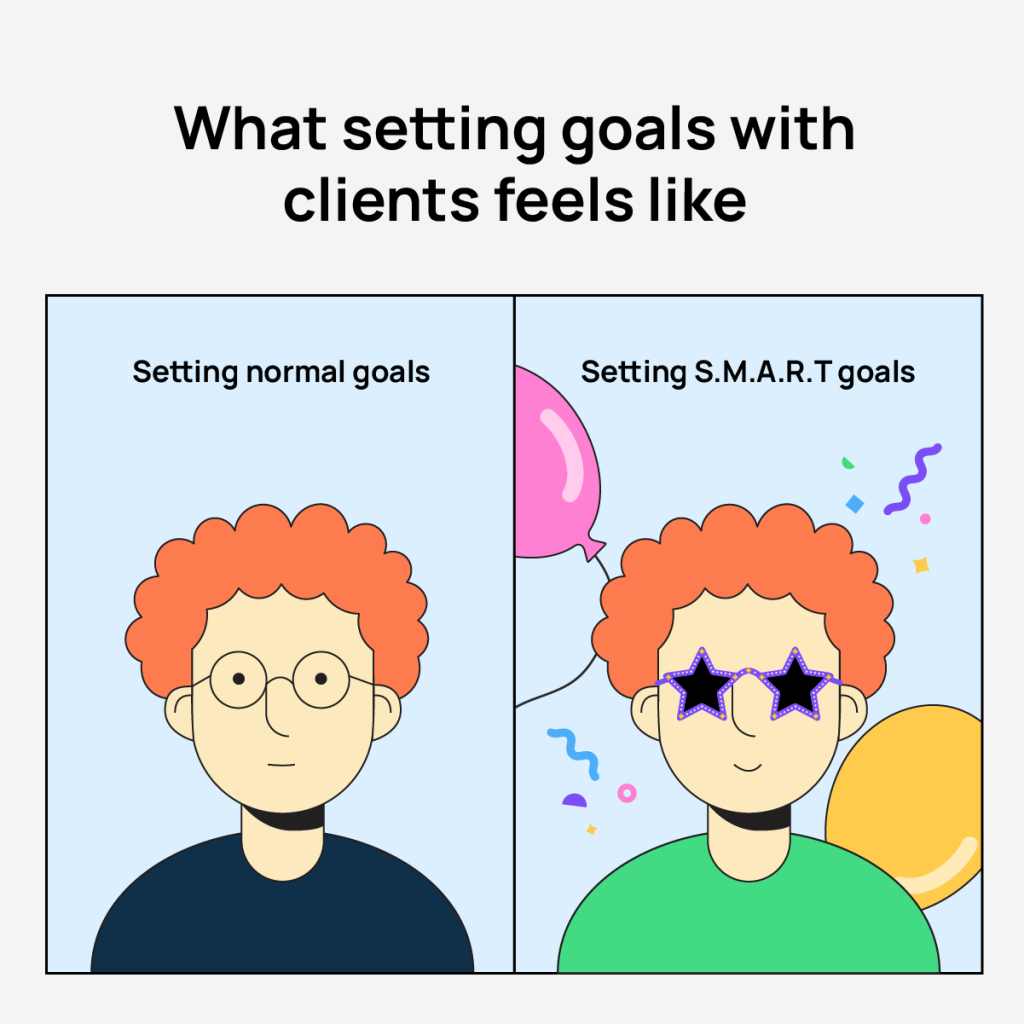
Quantitative goals based on accurate benchmarks
Data-driven marketing agencies set benchmarks and targets based on existing data, not best guesses or wishful thinking. To be truly data-driven, you should use your reports to study client trends and results and then set realistic marketing goals based on those numbers.
How to evaluate a data-driven agency: a checklist
If you’re looking for a data-driven marketing agency, here’s how to know if you’ve found one:
- When you ask them about their data analytics stack, they have a clear and convincing answer. They know where their data is coming from, how it’s prepared and transformed, how it’s analyzed, and how they’ll report on it.
- When you ask them about their marketing reports, they can confidently walk you through each one and explain exactly what it’s for and what it will show you.
- They have data-driven reasoning for each of the targets and goals they propose.
- They can modify and customize their marketing reporting for you—you won’t just get one-size-fits-all reporting.
- The whole agency is confident talking to you about data analytics, not just their data team.
How to become a data-driven marketing agency in 7 steps
It’s all very well to say, “We should be data-driven!” But how?
Many agencies assume that it’s simply a question of throwing money at the problem by buying a bunch of expensive tools. But it’s more about stepping back and figuring out what problems you’re trying to solve first before spending money on the wrong solution.
Here’s a five-step process for making the leap to data-driven:
1. Start by identifying the marketing channels you’re working with
Consider your existing customer base in some detail. Identify which marketing channels they’re primarily working with and where you’re usually involved. Make a list of all the potential channels you’ll want to be able to analyze and where that data is currently. For instance:
- Facebook Ads
- Google Ads
- Google Analytics 4
- LinkedIn Ads
- Instagram Insights
- TikTok Ads
And so on. This will show you how much data you’ll need to work with, how many channels you’ll need to report on, and the complexity of your requirements.
2. Decide on your reports
OK, you’ve got the data sources listed out. Now, it’s time to think about the reports you’re trying to create for your clients.
Don’t start by thinking about metrics just yet. Instead, consider the general topics you need to be able to report on to your clients. Do you need to show budget pacing? Do you need a paid channel mix report to see the ROI breakdown per channel? Do you want to report on blog performance? List all the topics you’ll need to inform your clients about.
3. Collect the metrics and dimensions you’ll need for each report
Now, you can get into the specific metrics you’ll need to track and analyze. Figure out which measures will help you advise your clients on the four types of marketing decisions.
Strategic decisions—long-term marketing decisions, like how your clients should spend their budget to gain maximum ROI.
Examples of strategic metrics:
- Customer lifetime value (CLV)
- Customer acquisition cost (CAC)
- Brand mentions/brand sentiment
- Customer retention rate
Operational decisions—making sure your clients are using their marketing team’s time wisely.
Examples of operational metrics:
- Marketing qualified leads (MQLs)
- Sales qualified leads (SQLs)
- Brand visibility
Optimization decisions—identifying ways to improve on what your clients are already doing.
Examples of optimization metrics:
- Bounce rate
- Time on page
- Click-through rate (CTR
- A/B test results
- Return on investment (ROI)
Tactical decisions—looking at the day-to-day implementation of the marketing strategy you’ve put together for the client.
Examples of tactical metrics:
- Web traffic
- Web conversion rate
- Social media engagement rates
- Email engagement rate
- Cost per acquisition (CPA)
4. Choose your preferred reporting tool
Now that you have identified your data sources and decided on what reports you’d like to have and what breakdowns you’d like to see in each report, you’ll have all the info you need to decide on the suitable tool based on your requirements and budget.
There are two main points to consider—the decisions you need to make and the quantity of data you’ll likely be working with.
For instance, if you’re working with lower data volumes or only need to make tactical and ad-hoc decisions, Looker Studio and Google Sheets might be a great choice:
- They’re relatively easy to use (even for less technical users).
- They’re free.
- They’re made by Google, so they work particularly well with Google platforms like Google Ads, Google Analytics 4, YouTube, etc.
However, if you’re working with multiple clients at once or dealing with a large volume of data, then Looker Studio might not be the right fit. There’s a good chance that you’ll find your Looker reports slow if you’re running a lot of data. In that case, you’ll probably need a data warehouse and possibly a more powerful reporting tool like Power BI.
Additional resource: Check out our Looker Studio vs. Power BI guide for a detailed comparison.
5. Consider data transformation
Here at Supermetrics, we often refer to data transformation as how you customize and manipulate your data to answer specific questions. This step helps you dive deeper into your data and find meaningful insights. The most common data transformation use cases are:
- Create new metrics: Functions such as addition, subtraction, multiplication, and division help you create new metrics for your report that aren’t available from the data sources. For example, to calculate net revenue, subtract ad spend from total revenue.
- Manage naming convention: Ad platforms usually have their own naming convention, which can make your report inaccurate and/or look messy. You can use functions like VLOOKUP to keep the name consistent. For example, if your data have ‘US’ and ‘USA’, you can set a rule to turn all variations into ‘United States’.
- Blend data from different sources: This is helpful when you combine data from different sources to get a holistic view of your performance. For example, you’ll need to blend data from platforms like Facebook Ads, Google Ads, etc., for a budget pacing report.
Spreadsheet tools like Google Sheets and Excel have many functions and formulas that let you play around with your data. We find that Power BI is better for data visualization tools like Looker Studio and Power BI for data transformation. But for simpler use cases, where you don’t need to use many data sources or calculations, Looker Studio works just fine.
If you’re a Supermetrics user, you can easily transform your data with Custom Fields and Data Blending features. We even covered the most popular data transformation use cases for Supermetrics.
6. Visualize the data
Your main job as a data-driven marketing agency is to help your clients make data-based decisions. That means you have a view of the data that lets you and your clients easily understand it, spot trends, and quickly pick up on sudden changes and outliers. In other words, you’ll need dashboards that show overviews and breakdowns of the performance of your various channels and campaigns.
Here are a bunch of free dashboard templates to get you started.
7. Communicate your insights
Dashboards are a great tool for monitoring performance, but to make sure you’re all on the same page, you’ll also need to report your data findings and insights to your clients—typically weekly, monthly, and quarterly.
For that, you’ll need a reporting deck where your clients can review the goals of their campaigns, monitor assets, track progress toward key milestones, and see the results of your efforts on their behalf.
If you’re not too sure about how to report on marketing data the right way, we’ve got a handy guide to marketing reporting for you.
Challenges to becoming a data-driven marketing agency and how to solve them
While many agencies aspire to be data-driven, only some achieve it. That’s understandable—the world of data analytics can be daunting, and several challenges can get in the way. Here’s what to do about them.
Problem #1: Using unclear comparison ranges or benchmarks
Clients may have a target in mind and ask you to put together a strategy to hit that target. There’s only one problem. The target in question—increasing MQLs by 20% this quarter, let’s say—isn’t based on anything (except maybe wishful thinking). So, if you fail to hit it, you’ll look bad—but nobody really knows where that number came from or whether it’s a realistic goal in the first place.
What to do instead:
Instead of committing to an unrealistic target, insist that your first step should be to find out what your targets should be in the first place. Use the client’s historical data to track, say, the rate of increase in MQLs that they’ve been achieving so far. Then, use that data to set a more realistic target to aim for.
Problem #2: Unclear ownership of metrics and analytics
Some agencies struggle with assigning clear responsibility for analyzing and reporting on data. If you have a data team, it might need to be clarified if reporting is the responsibility of Marketing Operations or the Data Analytics team. If you don’t have a data team, then it’s even more unclear—is data reporting the responsibility of your strategy or digital marketing teams?
What to do instead:
Regardless of the size of your agency, we recommend that you create the role of Head of Measurement (or a similar title.) This person will help to:
- Define what metrics you’re tracking for each client
- Create a robust data pipeline
- Set benchmarks and targets based on historical data
- Communicate with different teams to align on how to collect and prepare the data
- Either create data reports themselves or find a third-party provider
- Make sure the rest of the team can understand and use the reports
Problem #3: Lack of internal expertise
Having a bunch of Looker Studio reports is only good if people know how to modify or read them. We see many marketing agencies, especially smaller ones, where most of the team needs to learn how to use their analytics stack, doesn’t know how to create a new graph, and needs help understanding what each metric tells them.
There’s no shame in that—data analytics is a relatively new field, and there’s a lack of knowledge about even the basics in marketing.
What to do instead:
Recognize that if you want to be a data-driven agency, it’s not going to be enough to buy some tools or hire a data team.
You need everyone in the organization to have at least a basic grasp of the fundamentals of data analytics. They should be able to create a new graph or modify a report. Even if you’re using Google Sheets to look at your data, everyone should understand how the spreadsheets are structured, where the data came from, and what the formulas represent.
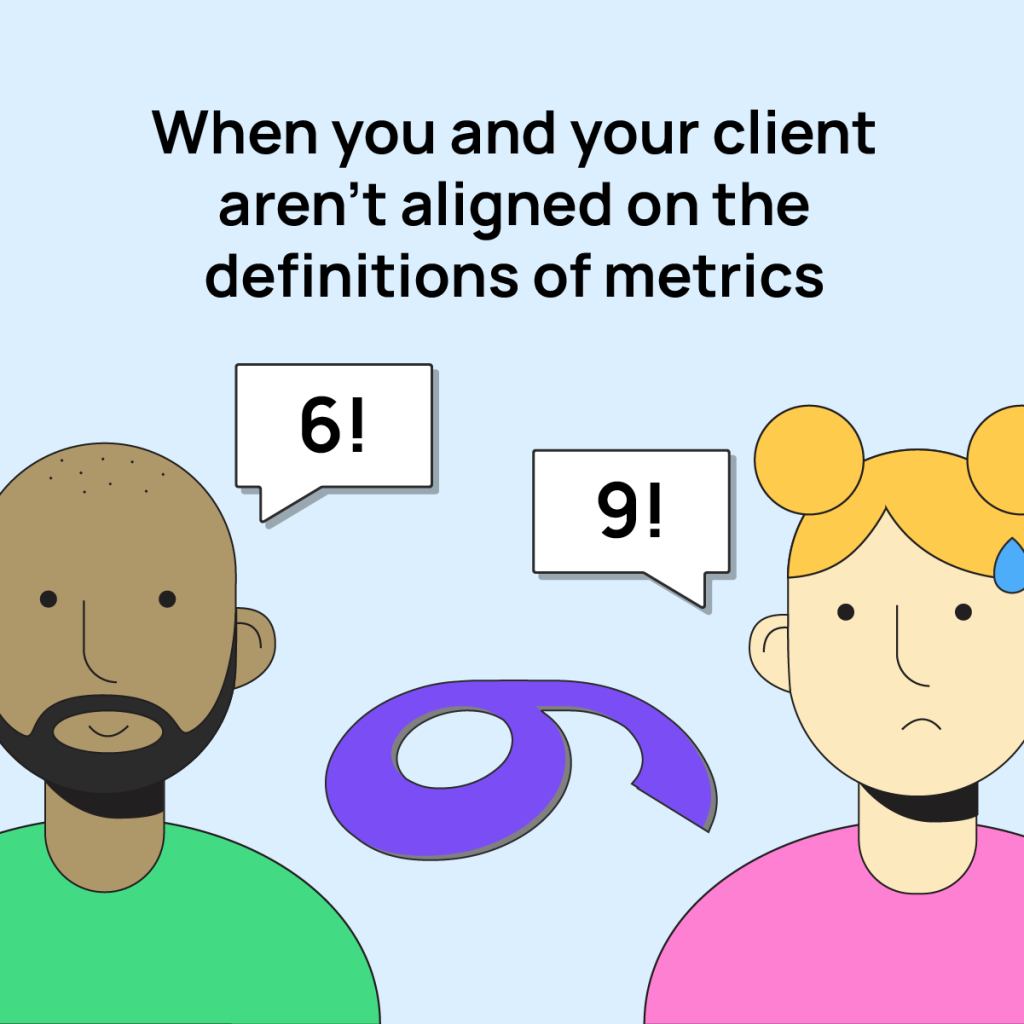
Problem #4: You’re not aligned on the definitions of metrics
Another common issue as you start to work more closely with data is suddenly realizing that you’re not all on the same page about what each metric truly means. Many companies struggle with this, but it’s particularly an issue for agencies that have to align on definitions both internally and with each new client.
What to do instead:
As part of your internal upskilling program, make sure that you decide on what key marketing KPIs mean in very precise terms. How do you define MQLs, SQLs, and PQLs? How do you distinguish between leads and opportunities? Which metrics will you prioritize in tracking and reporting?
Then, when you work with a new client, make sure that you build this alignment process into the onboarding journey so that you all use the same terms.
How to get your clients excited about data
Some clients may be coming to you for data-driven insights—but others may not be familiar with the benefits of using data and may even be resistant to sharing their data with you. If you’re running into clients that aren’t particularly data-savvy, here are a few tips:
Speak their language
You may be excited about your new data warehouse, but we’d recommend dropping the tech talk and speaking the love language of all good marketers—return on investment (ROI). Specifically, you can explain that with proper marketing analytics, they can stop wasting money on underperforming campaigns and start investing in channels that will deliver better returns.
Show them what to start, stop, and continue
Data won’t just help your clients save money and get better ROI. It will also help them use their time better. We like the Start/Stop/Continue framework for this. You can use your analytics to help clients:
- Start using new and more effective tactics
- Stop wasting money on tactics that aren’t working
- Continue investing in tactics that deliver a strong return
Framing data in this way, rather than getting into all the metrics and nitty-gritty, can make analytics seem straightforward for even the most hardened anti-data Luddite.
Prove your point with A/B testing
Show your clients that data-based targets will be more effective and realistic. For instance, run an A/B test where you set one target based on arbitrary objectives and one based on benchmarks derived from historical data. We’d bet you that the data-backed targets are more realistic and accurate, and this should prove to your clients that this approach to setting targets will give them far better long-term results.
Resources for becoming more data-driven
Becoming more data-driven can be a challenge if you don’t have internal expertise (or the budget to hire a bunch of data experts). Here are some free resources to help you get started:
The basics of data-driven marketing
There’s a wealth of information about marketing data online. Encourage your team to invest a few hours a week learning the basics of data-driven approaches to marketing. Here are a few free resources to get you started:
- How to make data-driven decisions
- How to use data to measure marketing results
- The basics of marketing reporting
- Budget pacing for marketers
The fundamentals of data analytics tools
You can get a solid understanding of most marketing analytics tools with just a few hours of study. For instance, here are a few free courses we’ve put together for you:
Find more free webinars here.
Marketing reporting templates
Here’s a stash of free marketing reporting templates:
- Paid channel mix
- Website performance
- Content marketing
- Email marketing report
- Campaign budget pacing
You can find a lot more report templates in our template gallery.
Over to you
That’s all we have to say about the topic. If you’re ready to become a data-driven marketing agency, you’ll need:
- A clean data pipeline
- The right data analytics stack for your needs and budget
- Well-designed, easy-to-understand marketing reports
- A solid grasp of the fundamentals of data analytics
About the author

Anna Shutko
Anna is a Marketer turned Data Consultant with 10+ years of experience in the field. Currently, she specializes in building data warehouses for our biggest clients to help them drive informed decision-making. She joined Supermetrics as team member #7 and has contributed to growing the business from a startup to a marketing analytics industry leader as a Product Marketing Manager and later Brand Strategist.
Rosanna Campbell
Rosanna is a Freelance Content Writer who writes non-boring content for B2B SaaS clients like Lattice, Dock, and monday.com. She lives in Spain with her husband, her son, and a beagle who eats her furniture.
Turn your marketing data into opportunity
We streamline your marketing data so you can focus on the insights.